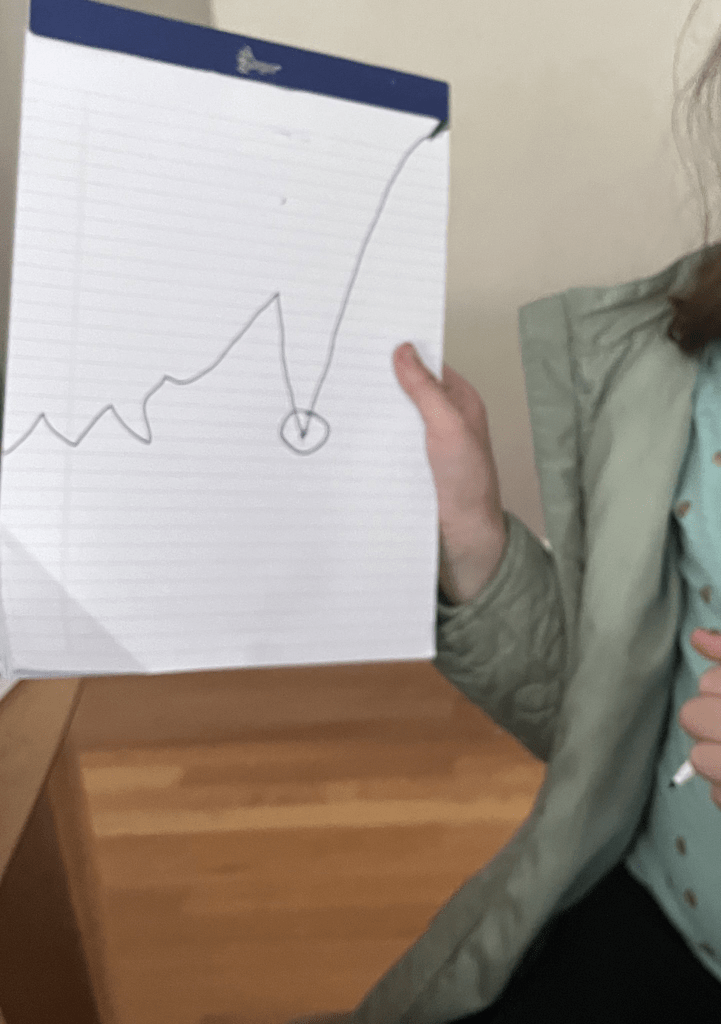
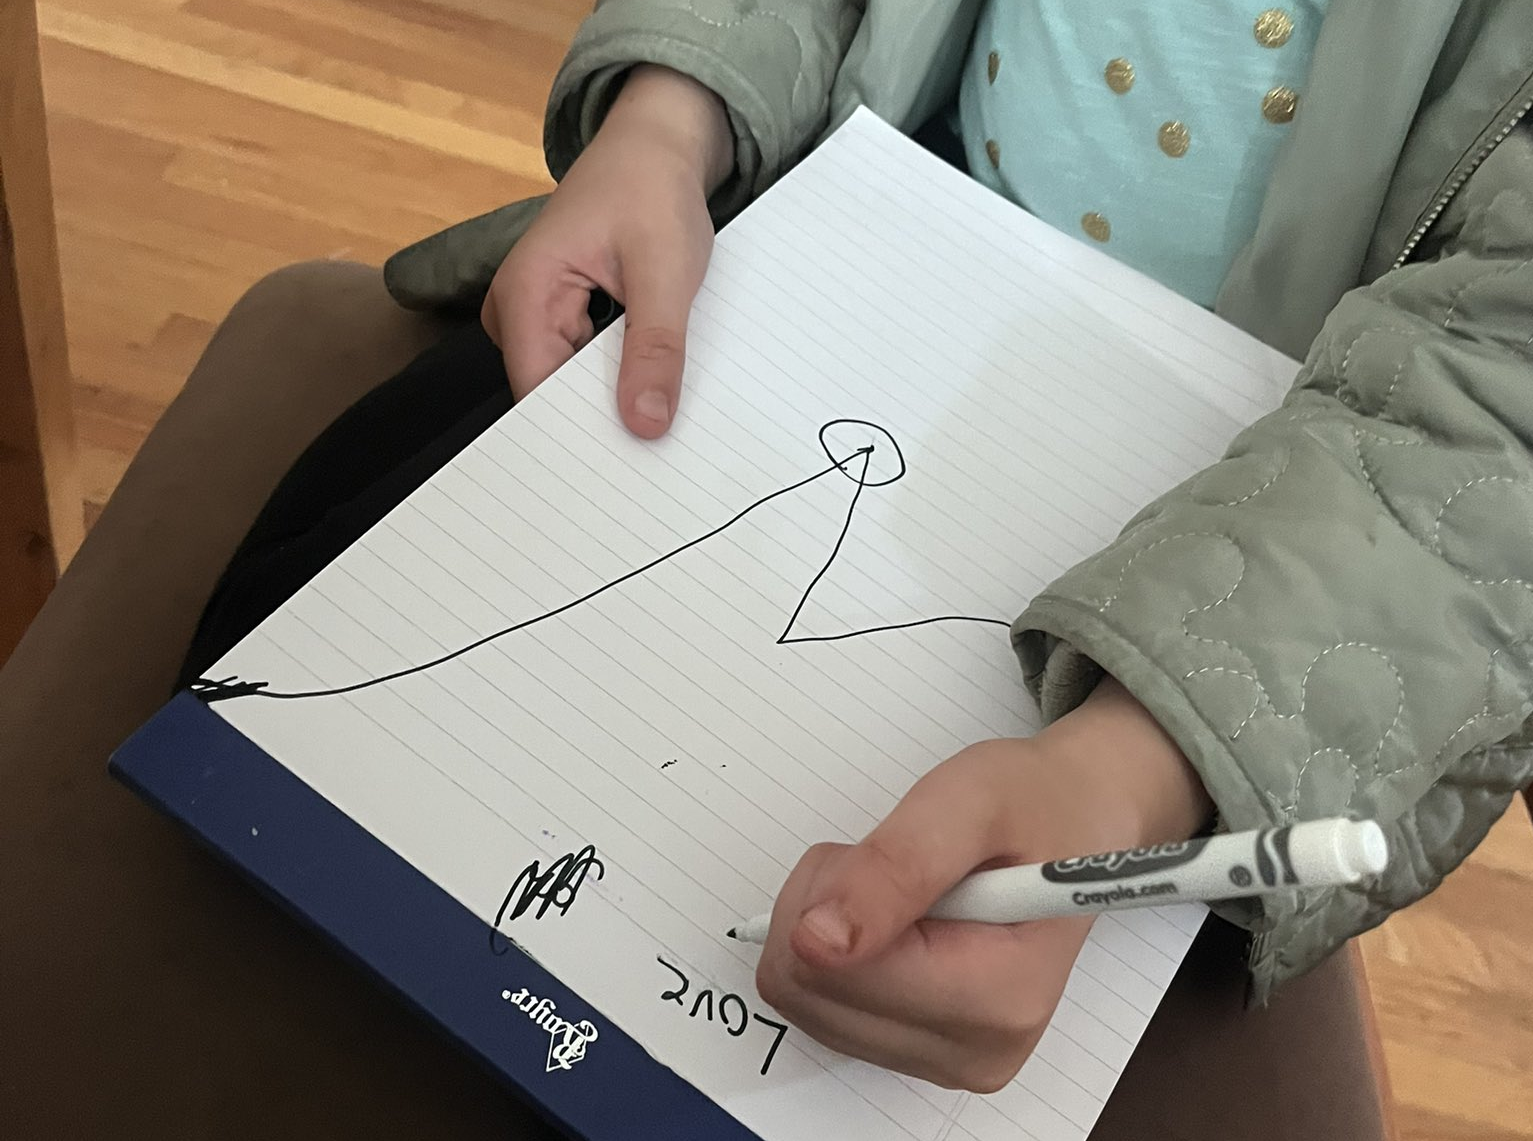
My 8yo daughter, S, held up a piece of paper with a jagged line drawn on it. “Mama. What do you notice? Do you see any high points? Or low points?”
I looked up from my yogurt and considered it. “It goes up and down, and up and down… and, yes, I see high points, and low points.”
“Where?” She asked me. “Do you mean here?” She circled a low point before I could so much as gesture towards it.
“Yes!” I nodded emphatically, and put the yogurt down.
“Why do you think this is so low?” She asked, with trained neutrality. She’s an experienced teacher in an 8 year old’s body.
I shrugged. “I don’t know. It depends on what the graph is about.”
S rolled her yes, and exercised some patience with me. Clearly, I was missing the point. “Yes. And what do you think the graph is about?”
I made a few stabs in the dark. Temperature? Money in a back account? I thought our little game was coming to a close, but I was wrong.
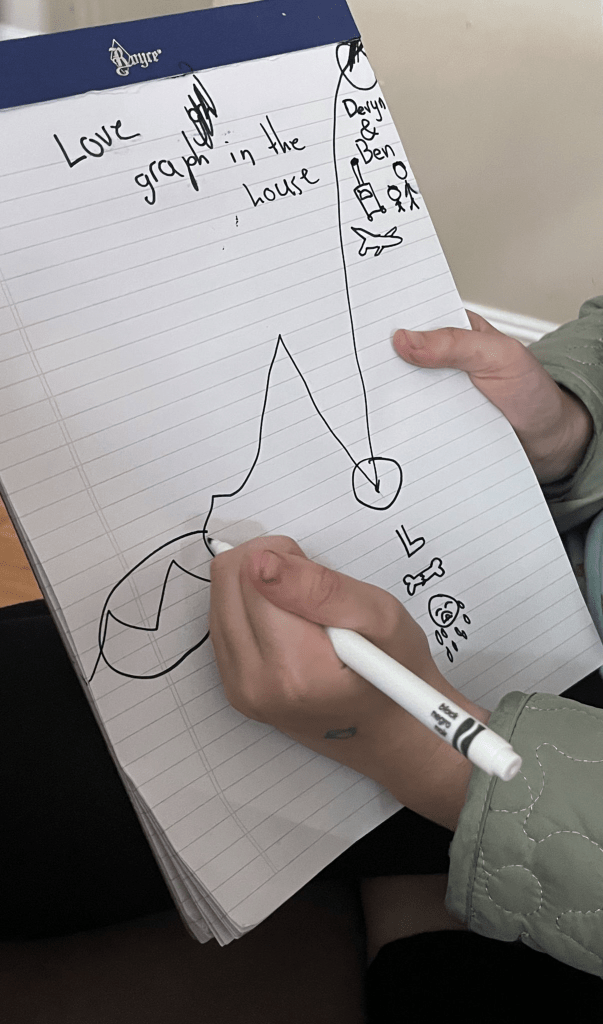
She put the pad of paper in her lab, and wrote a title: “Love Graph in the House.”
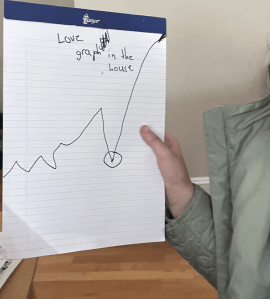
S was making a slow reveal graph! She has seen me facilitate them a few times, but it was fascinating to see how she adapted it, drawing and annotating each reveal herself.
She continued somewhat impatiently: “so what do you think the low point is about now?”
“Is it when you and your brother were fighting?”
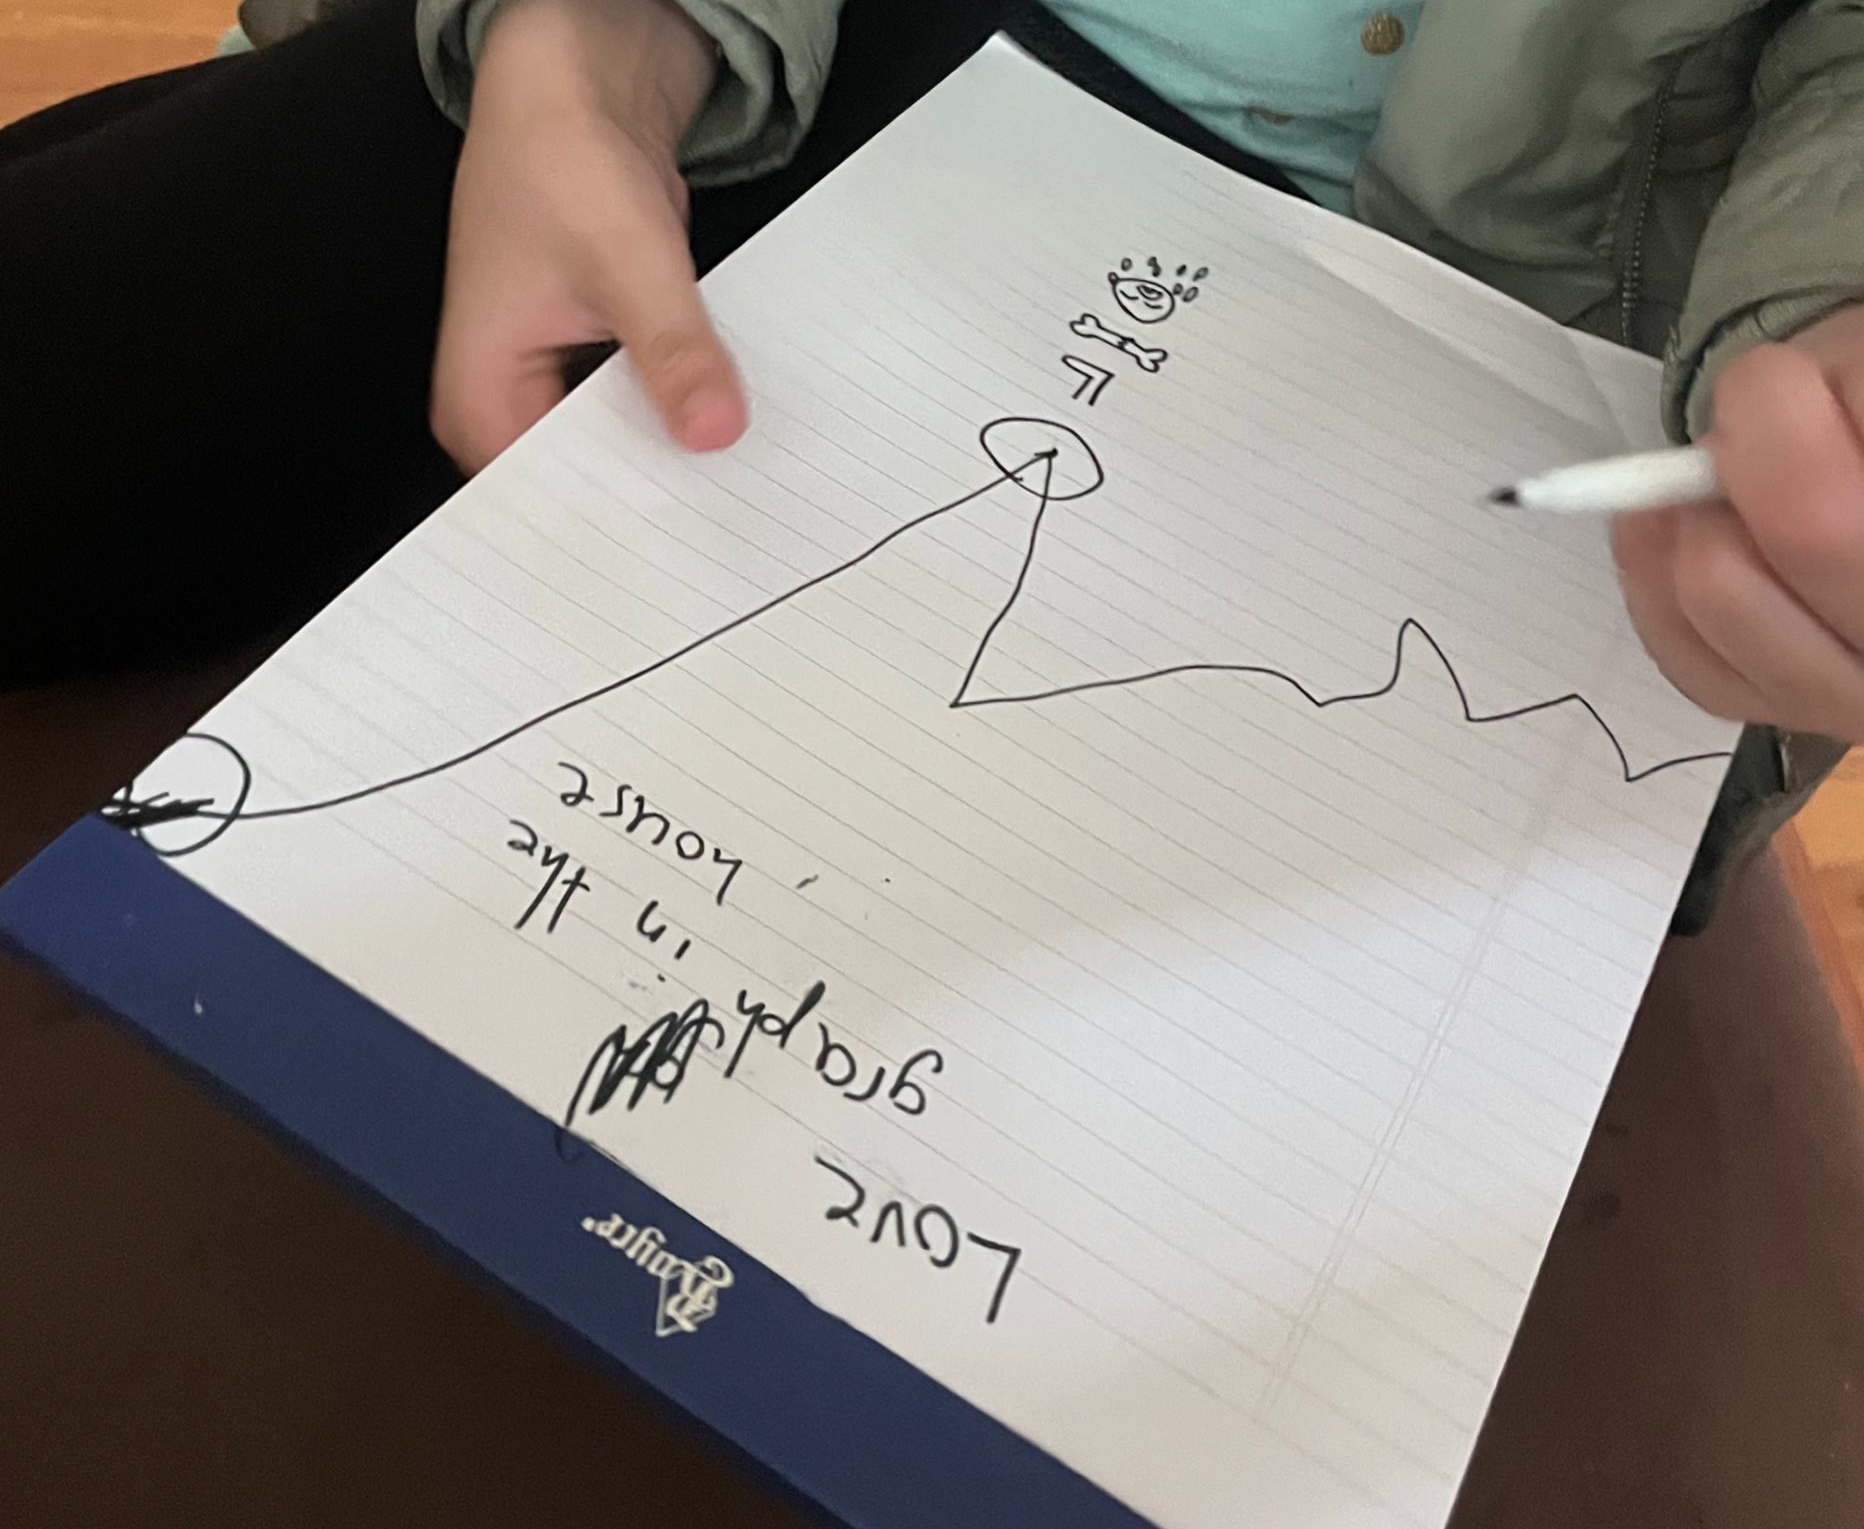
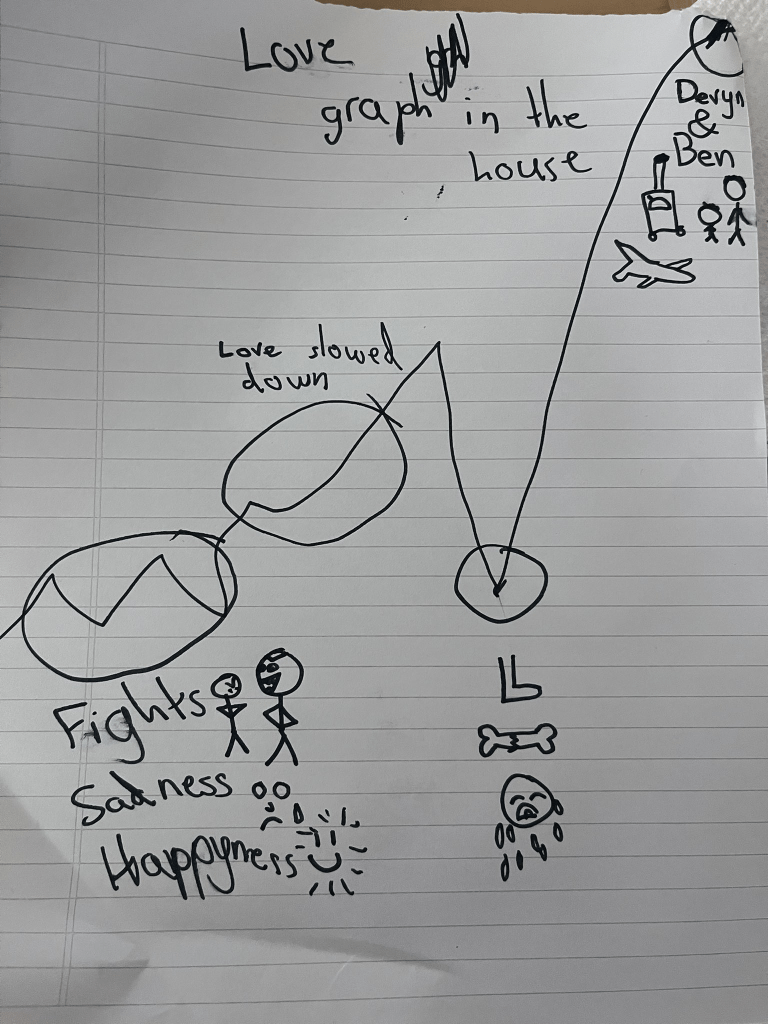
S returned the pad of paper to her lab, and drew several icons below the low point: a foot, a broken bone, and a crying face. My 6yo had broken his foot a few days earlier. I sent S to swim at a local pond with her cousin and uncle while I took my son to the urgent care. She was devastated to learn that it was broken, and that she wasn’t there to support him. (He seemed fine.)
“So why do you think the love in increased so much after he broke his foot?”
I paused, then offered, “maybe we all bonded together to help and support one another?” This was, after all, from S’s perspective. How did the broken foot impact her?
“Hmm. Maybe,” she said, tracing her finger up the line. “But I think it’s more because Ben came to visit.” Ben is my brother, and he and his 1yo daughter were staying with us for a few days — a long awaited trip. S added some more icons to the graph: a suitcase, stick figures, and a plane.
Then she circled a particularly tumultuous section at the beginning of the graph.
“And what do you think this zig zaggy part is, mama?”
“Were you not getting along with your brother there?”
S narrowed her eyes, considering it. “Yeah, basically. Okay. ” She annotated: fights. Sadness. Happyness. She drew two stick figures turned away from one another.
“And how about this part here? It doesn’t go up as fast, so the love slowed down,” S asked while circling and continuing to annotate.
My husband Farid walked past us, on his way to get a glass of water. “What’s this?” He asked, a singular eyebrow raised. (It never fails to make S laugh.)
“A love graph,” S responded.
“Why is there less love with the broken foot? Didn’t we give you guys extra love that day? Shouldn’t it be higher?”
“I was very sad,” S persisted. “My baby brother was hurt.”
“But does that mean there was less love?”
S glared. Daggers. This was her creation, her expression. Farid shrugged, filled his glass, and left the room.
“What was it about the love slowing down?” I asked.
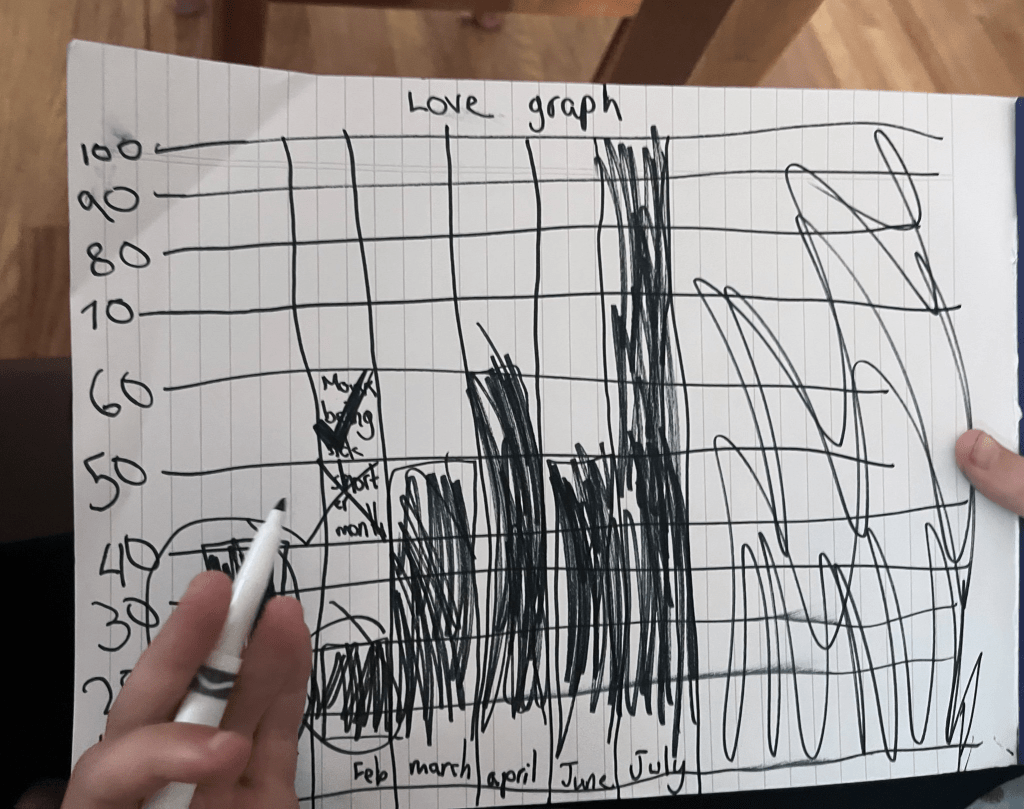
By this point, S wasn’t interested. She tore the page off the pad, and ceremoniously placed it on the table. She then started to draw a bar graph. She drew bars of varying heights, and labeled the y-axis with multiples of ten.
“What do you think the bars are?” S asked me.
“Different things that happened? Like the broken foot?”
S smirked. I had a sneaking suspicion that she was rewriting the reveal as she went. She labeled each bar with a month. (She missed May.)
“Why do you think February was so low?”
“Hmm… well, it has fewer days, so maybe there wasn’t as much time to build up all the love,” I suggested. She annotated it, but seemed unsatisfied. She gestured me onward. “Umm… I got COVID? SO I was sick for a good portion of the month, and I quarantined away from the rest of the family so that I wouldn’t make you sick.” She wrote it down, and then wrote a big check. That was it.
She then tore off the page — a big flourish! — and drew a third graph. She labeled it “Sadness graph + grumpyness + anger & fights.” It was the inverse fo the love graphs.
February had less love in the previous bar graph, and more sadness in this graph. At least she was internally consistent! She asked me if I noticed anything, and I pointed out that July was barely perceptible. “Is that because we rae only a few days into the month?”
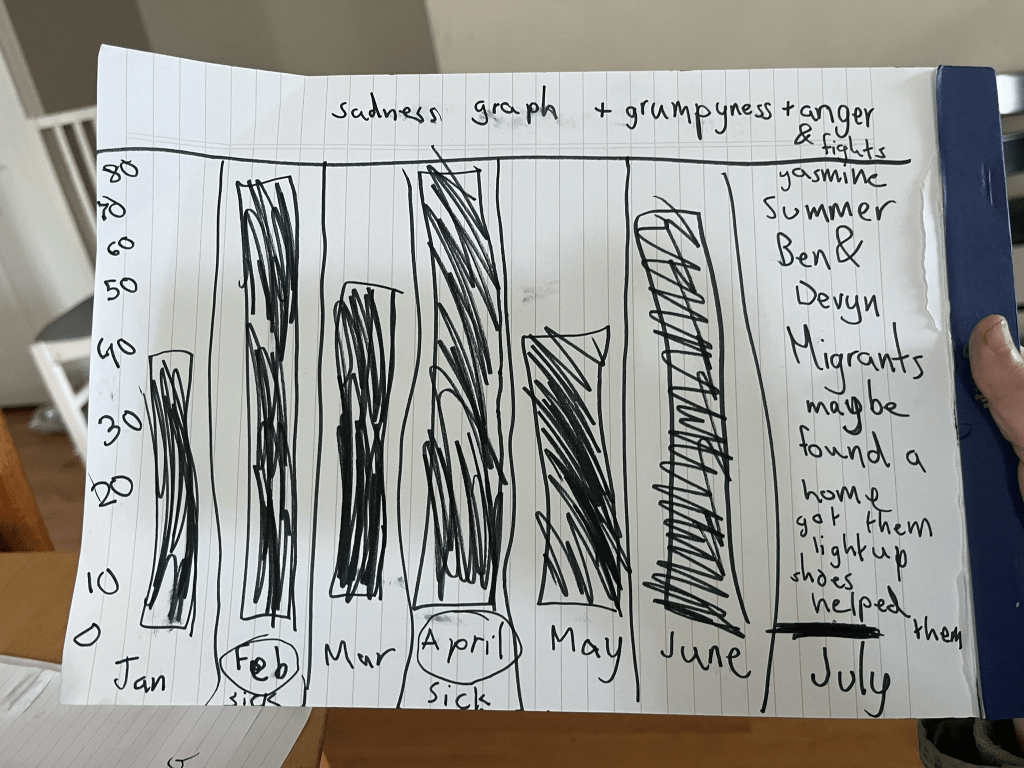
“Nope!” She smiled, and started to make a list of all of the things that reduced her sadness this month.
- Yasmine (her cousin, visiting from Algeria)
- Summer
- Ben & Devyn
- Migrants maybe found a home
- Got them light up shoes
- Helped them
What increases love? What decreases sadness?
S had seemed particularly cheerful the last few weeks. We had time with family, but also she loved the volunteer aid work we were doing with migrant families temporarily living in Terminal E of Boston Logan International Airport. For several months, a group of friends (and friends of friends) had worked to organize food and supply for the migrants. These people were often new to the US, and would spend the days at welcome centers only to be told that there was no room in the shelters for the night. They would make their way back to the airport, where they did not have any food, or access to showers or laundry or basic human needs. My friends and I signed up for days to cook, package, and distribute. Now that summer had arrived, I was spending many evenings at the airport with the 300 or so people that were there for the night. It took hours to distribute food. Blankets. Suitcases. Clothes. Diapers. Toys. We would assess the needs of the most recent newcomers. On more than one occasion we would rush to a grocery store in East Boston for emergency rations of baby formula, throwing cans of Similac hastily into the basket while the PA system repeated “five minutes left until closing, shoppers.” I brought my children with me, and my daughter was a natural. She systematically handed out the dinners and snack bags before moving onto the non-perishable items. S had become particularly attached to a group of girls, who asked us every night for new shoes. (“Con luces!”) My daughter convinced Farid to buy new light up sneakers for them.
It was curious to me that this arduous and challenging task also decreased her sadness. “I was disappointed that I wouldn’t get to see my school friends once school ended, but then helping the migrants made me happy.” I had talked with her about how we need to help for the sake of helping. Nobody owes us a smile, or even a thank you. We are doing this because it’s important work. It’s painful to face the conditions there, and we should recognize that we are privileged but not superior. I told my kids about how my husband had lived in a tent after a devastating earthquake destroyed the city he was living in. This can happen to anyone. We had also read a graphic novel about the Haitian Revolution, and I had told them that slavery leaves pain for many, many generations. The racism and poverty left in the wake of slavery ultimately hurts everyone, us included, but hurts Black people a lot more. It’s not fair. It’s hard to understand, even for me as an adult. (Do I understand it? Was I messing up this conversation?) And the work can feel a little bit like we are saviors, but we aren’t. Everyone should have basic living necessities. Fact. The government is struggling to meet these people’s needs, so we step in.
These conversations felt like weighted stones on my chest — like we were living in the universe of the Giver — but my daughter was saying that she was experiencing a decrease in sadness. She didn’t feel powerless. She felt like she was making a difference.
Math Helps Us Communicate
Okay, I will admit that I loved that S was mimicking me throughout her slow reveal graphs. She was making moves that she’s seen me do, and annotating in her own way. It was imitation as the most sincere form of flattery.
This also showed that S is learning how to quantify and represent things in her world. She had ideas about the strength of different feelings — love, sadness — and also identified contributing factors and their coefficient. She understands that graphs tell a story. She thought about scale. She thought about slope. She just finished second grade, so she doesn’t have real vocabulary to discuss these concepts, but she’s showing glimmers of understanding. And S is not alone: many kids have early understandings of concepts that we don’t formalize in school for years. When they enter 8th grade, they’ve had some experiences that have already build ideas around measuring and representing change. How can we build off these ideas in the classroom?
And it helped me understand how she was feeling in a different way. I had seen her melt down at the news of her brother’s broken foot, but it felt like the emotions were fleeting. Seeing both the line graph and the two bar graphs added shades of meaning. Eight year olds have complicated lives.
This made me want to have more conversations about data with her, but also to think about how I can help her use data to communicate things her life when she feels I “just don’t understand.” (She’s 8 going on 18.) How can we use multiple forms of communication in our own life to tell a story?
Discover more from Jenna Laib
Subscribe to get the latest posts sent to your email.

What an amazing child. . Thank you for sharing. So very special
Sent from my iPhone
LikeLiked by 1 person
Thank you! 💛
LikeLike
This is beautiful for so many reasons. The way S facilitated the slow reveal speaks volumes to the love she has for you and her whole family. The multiple representations shows how comfortable S is with communicating with data/ graphs. And seeing the math in love by making a graph about love felt/shared over time is as good as finding love in math.
I got choked up while reading this. And will read it again tomorrow! Thank you for sharing this amazing story.
LikeLiked by 1 person
Thank you for the kind words! 💛 I appreciate it!
It was such a lovely moment with S. She expresses herself well verbally, so the fact that I felt like I learned more about her experience from the graphs was illuminating for me.
LikeLike